I am tracing three linked things: redlining and exclusion, which shaped who could own and fix up housing; freeways and clearance, which cut neighborhoods apart and loaded some corridors with diesel and noise; and today’s green investment, which often targets the same flatlands where land stayed cheaper after decades of harm. None of that means every new bioswale is a conspiracy. It means the map is political, and “green” language can speed up a market that already treats some renters as disposable.
Redlining and the color of “risk”
In the 1930s the Home Owners’ Loan Corporation drew “security maps” that graded blocks for mortgage lending. Places with Black residents, immigrants, and older housing often got the lowest grades. Red shading did not create racism, but it moved money: banks and insurers followed the map logic, and maintenance loans skipped whole parts of the city.
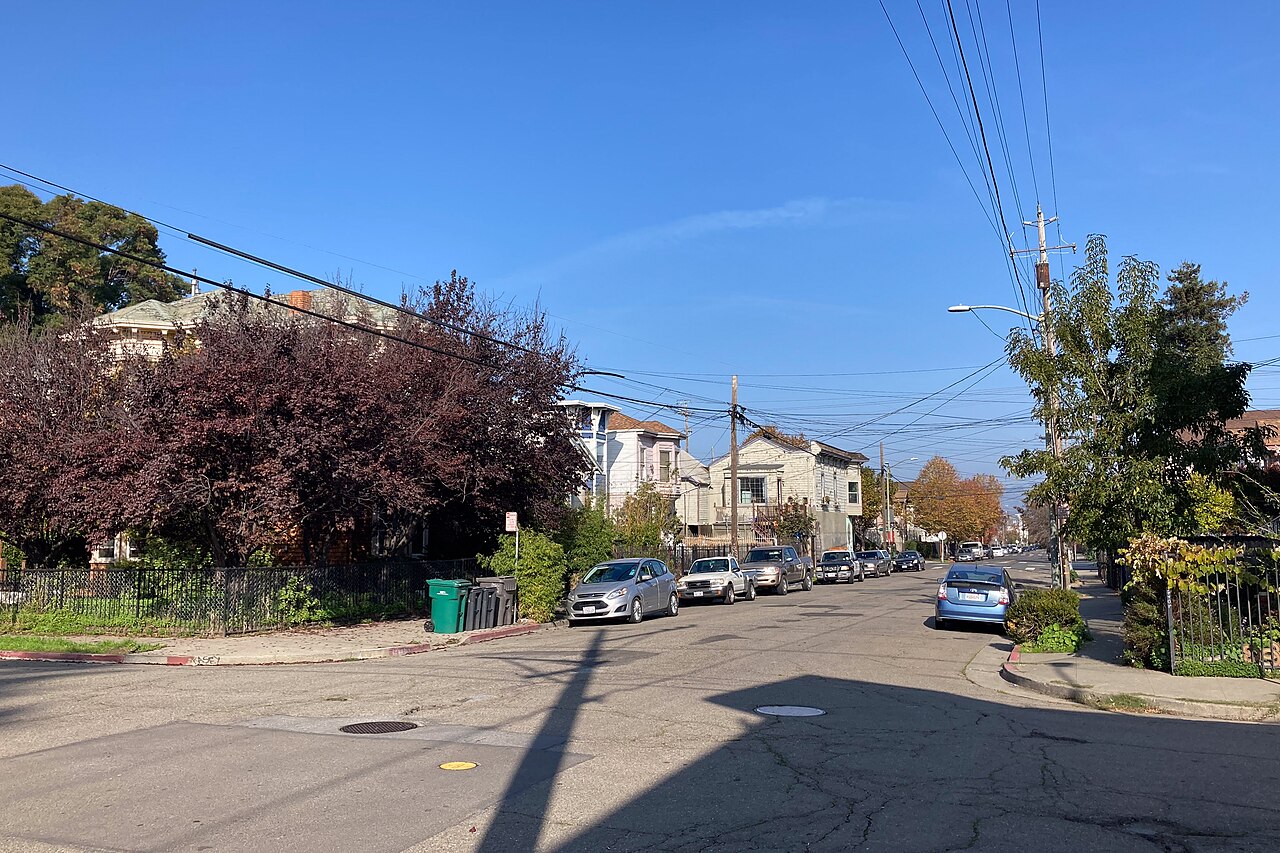
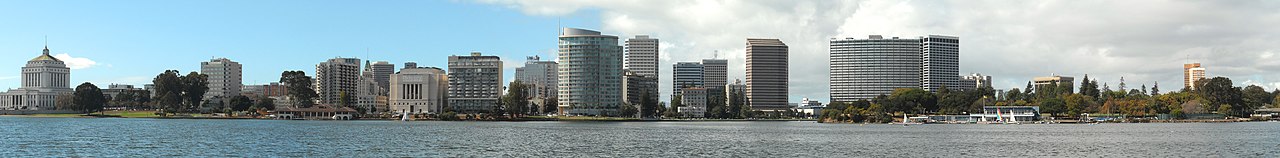
In Oakland the flatlands, including big chunks of West and East Oakland, show up in those histories as places credit was supposed to avoid. People still built lives there, but on worse terms: land contracts, higher interest, less ability to pass wealth down. Public spending often followed the same bias. Parks and street trees were easier to find in districts that already had political pull, while industrial uses and highway departments got routed toward places with less power.
Digitized HOLC maps for Oakland (1937) live in the University of Richmond’s Mapping Inequality project. Area descriptions on those maps often name race and “infiltration” explicitly, which matters when people treat redlining as a metaphor instead of a paper trail.
A multi-city California study (Nardone et al., 2019, UC Berkeley / UCSF, reported in Berkeley News and related outlets) found residents of historically red-graded neighborhoods had asthma-related emergency visits about 2.4× as often as in green-graded areas, with diesel PM levels nearly twice as high. I cite it here as population-level evidence, not proof about any one household.
How I use the word here
Redlining means the structured denial of loans and services in neighborhoods marked “risky” because of race and class, backed by maps and rules that looked neutral on paper.
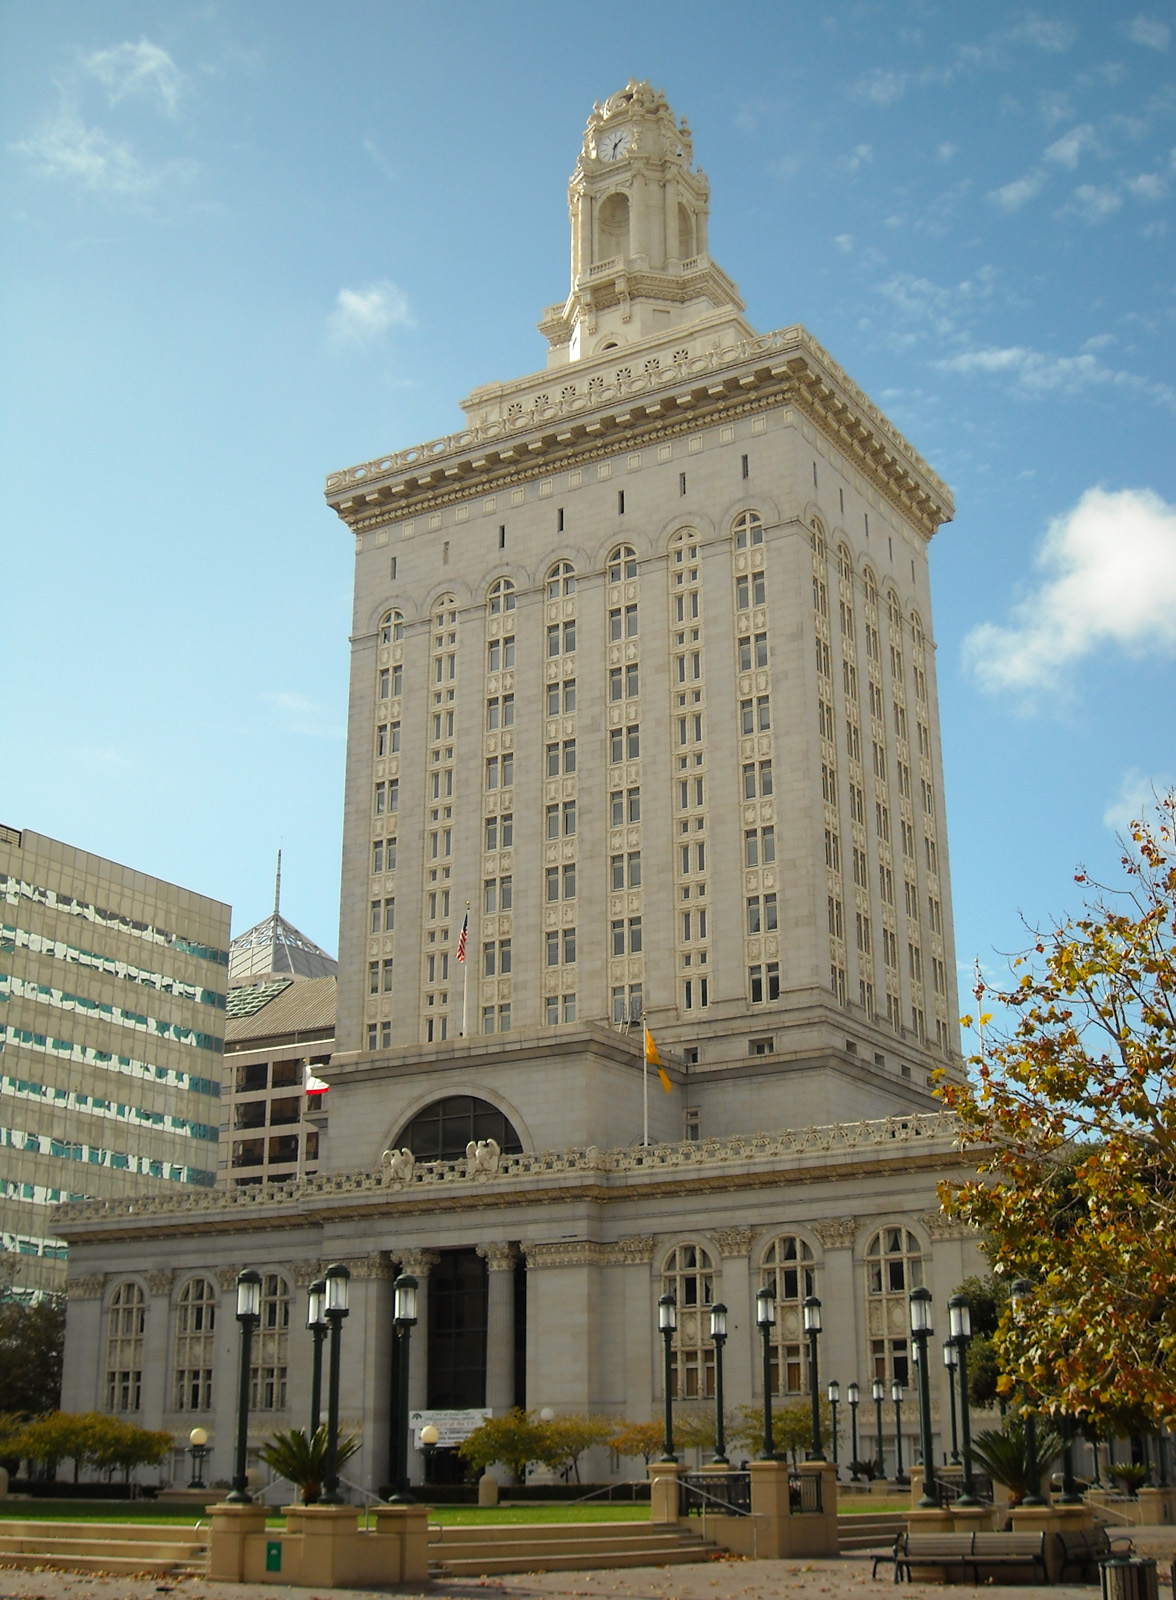
A park is never only a park. It is also a signal to investors about which blocks are suddenly “worth” marketing as healthy and green.
Freeways through Black Oakland
After World War II, state and regional planners ran interstates and connectors through cities in ways that destroyed housing and split neighborhoods. West Oakland is the example everyone should know. Interstate 980 opened in 1985 (about 1.6 miles from I-880 to I-580) through a predominantly Black area sometimes called “the Harlem of the West.” Public histories and advocacy summaries (for example ConnectOakland) commonly cite 503 homes, 22 businesses, 4 churches, and 155 trees cleared for the corridor. Post-1985, West Oakland sat ringed by freeways (I-980, I-880, I-580/SR-24). Caltrans’s Vision 980 study (2023–present; district project page) explores scenarios from enhancement to cap or removal. Reporting in outlets such as The Oaklandside (2024) captures a real tension: some neighbors fear removal could invite market-rate development and accelerate gentrification. I am not endorsing a single engineering option here; the point is that the corridor is politically live, not settled history.
CalEnviroScreen and related screening tools often rank tracts near I-980 among the highest statewide for pollution burden; West Oakland asthma indicators appear in the 99th–100th percentile band in public maps, useful for relative burden, not as a personal diagnosis.
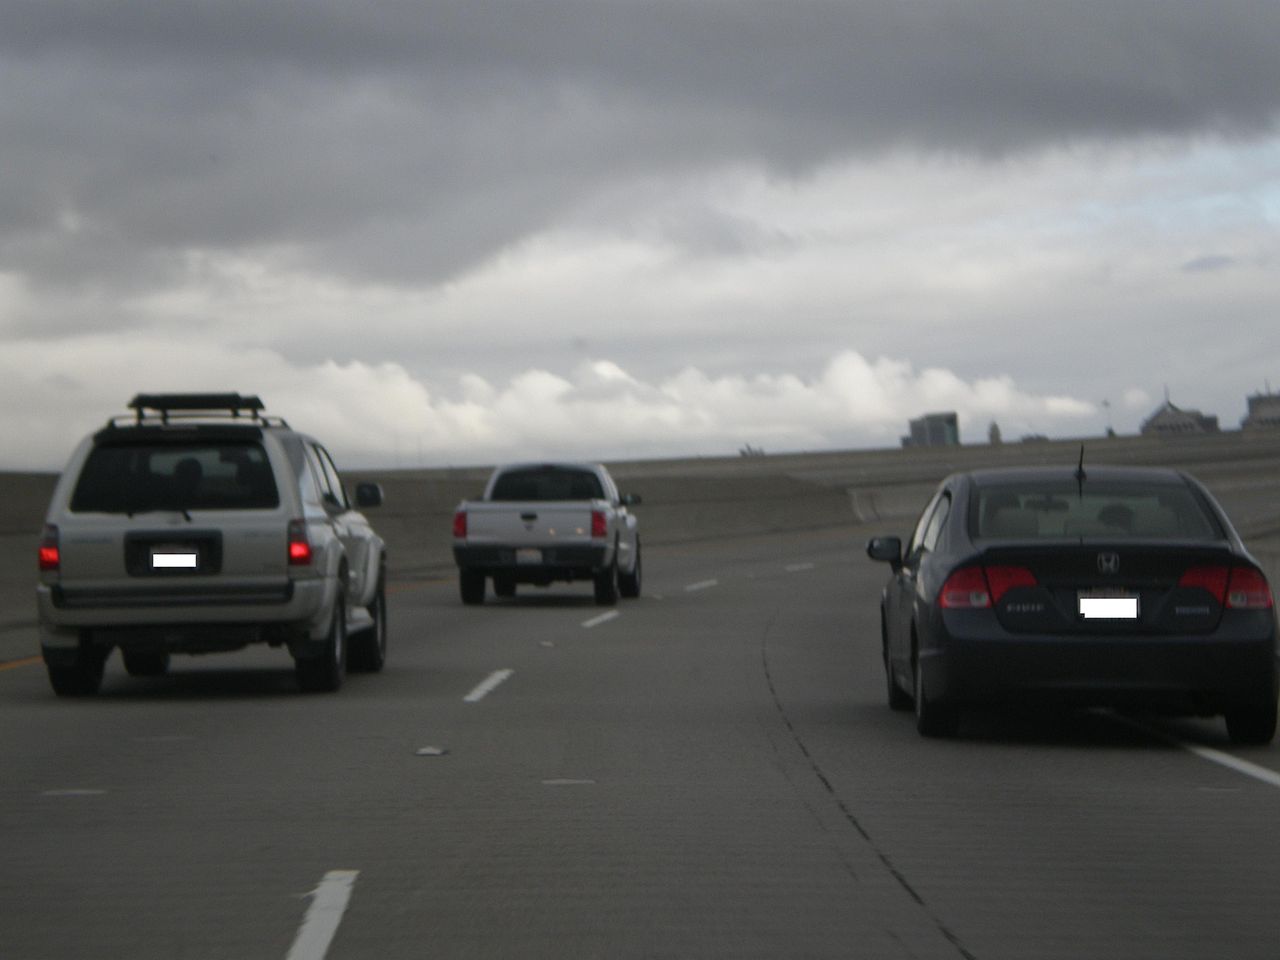
Environmental justice work starts from that fact: the same bodies asked to carry regional freight and commute traffic are the ones with higher asthma rates and shorter life expectancy in public health data. When a city later paints a “green” story near those corridors, people are right to ask whether the project cleans the air for residents or mainly pretties the edge for new buyers. Timing is not innocence. Neither is branding.
What I looked at in primary materials
I layered a HOLC-style map over present-day tree canopy and particulate estimates. The fit is not one to one, and I am not claiming it is. What shows up is a pattern: harm stacked in the same geographies that later get sold as “emerging” when capital circles back.
From redlining to “greenlining”
Researchers talk about green gentrification when parks, trails, or climate projects track onto disinvested neighborhoods and land values climb. Anguelovski et al. (2019, 2024) define it as the combined process of greening, land revaluation, and displacement. Rigolon & Németh (2020), in work summarized in later reviews, found U.S. neighborhoods within about 800 m (0.5 mi) of a new park were roughly 200% more likely to gentrify in their study context. Again, a statistical pattern, not a verdict on any one project. Oakland still needs tract-specific work; I use the literature to frame questions, not to paste those coefficients onto a local map without methods.
The sustainability language can make displacement feel like a side effect nobody meant, which makes it harder to pin down responsibility.
Oakland’s housing math is brutal: too few protected units, lots of owner and investor pressure, regional job growth that does not match local wages. Even a modest amenity can land in a Zillow blurb. That does not mean communities should say no to shade or recreation. It means those wins need tenant protections, community land, and enforcement so renters are not the ones who pay for the new postcard view.
- 1930s to 1940s Federal maps and covenants steer credit away from flatlands neighborhoods; Black and immigrant households face higher barriers to ownership.
- 1950s to 1970s Freeways and “renewal” demolish and divide; industrial zoning concentrates pollution in communities of color.
- Late 20th century Job loss and disinvestment hit parts of East and West Oakland hard; speculators buy low where public narratives blame residents for poverty.
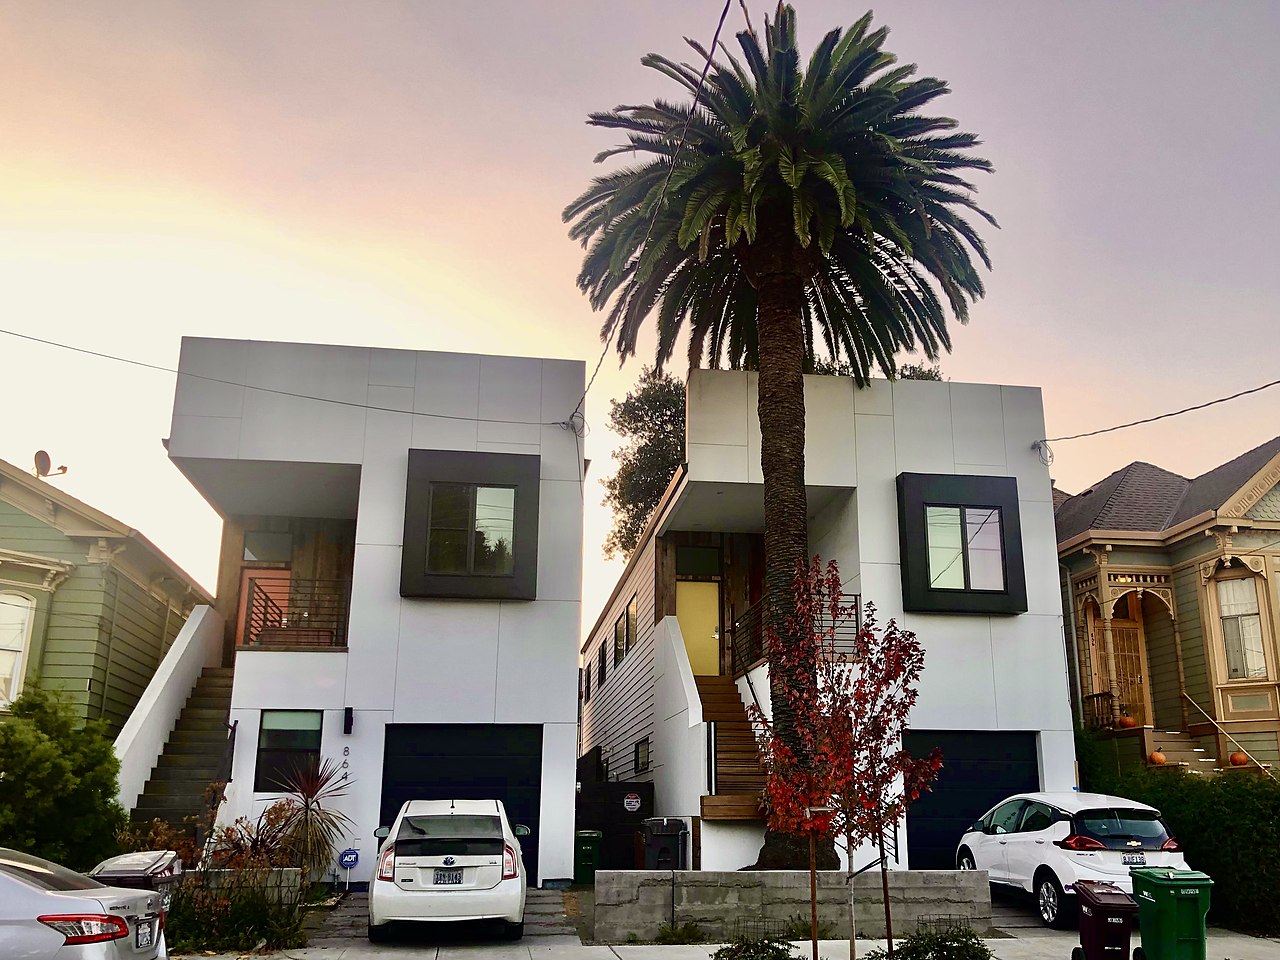
- 2000s to now Parks, bay edges, and “resilience” branding arrive while regional housing demand climbs; renters face harassment and no-fault moves even when the city celebrates a new ribbon cut.
Green infrastructure as displacement pressure
Bioswales, trails, and expanded parks can cool streets and handle stormwater. I am glad those tools exist. The failure is when cities treat them like advertisement for a hotter real estate play instead of pairing them with anti-displacement money and real decision-making power for people who rent.
In practice I am reading about: rent spikes after an area gets rebranded; landlords offering cash to leave; code complaints used as pressure; long meetings that collect stories but do not shift who owns land; construction dust and detours that hit elders and disabled neighbors first. Those are not natural disasters. They are policy and profit choices.
How I am arguing
Green amenities are one switch in a whole system: finance, zoning, eviction courts, policing, regional commuting patterns. I focus on green investment because it is visible and because city press releases love it, not because I think a park is the only villain in the story.
Related pages
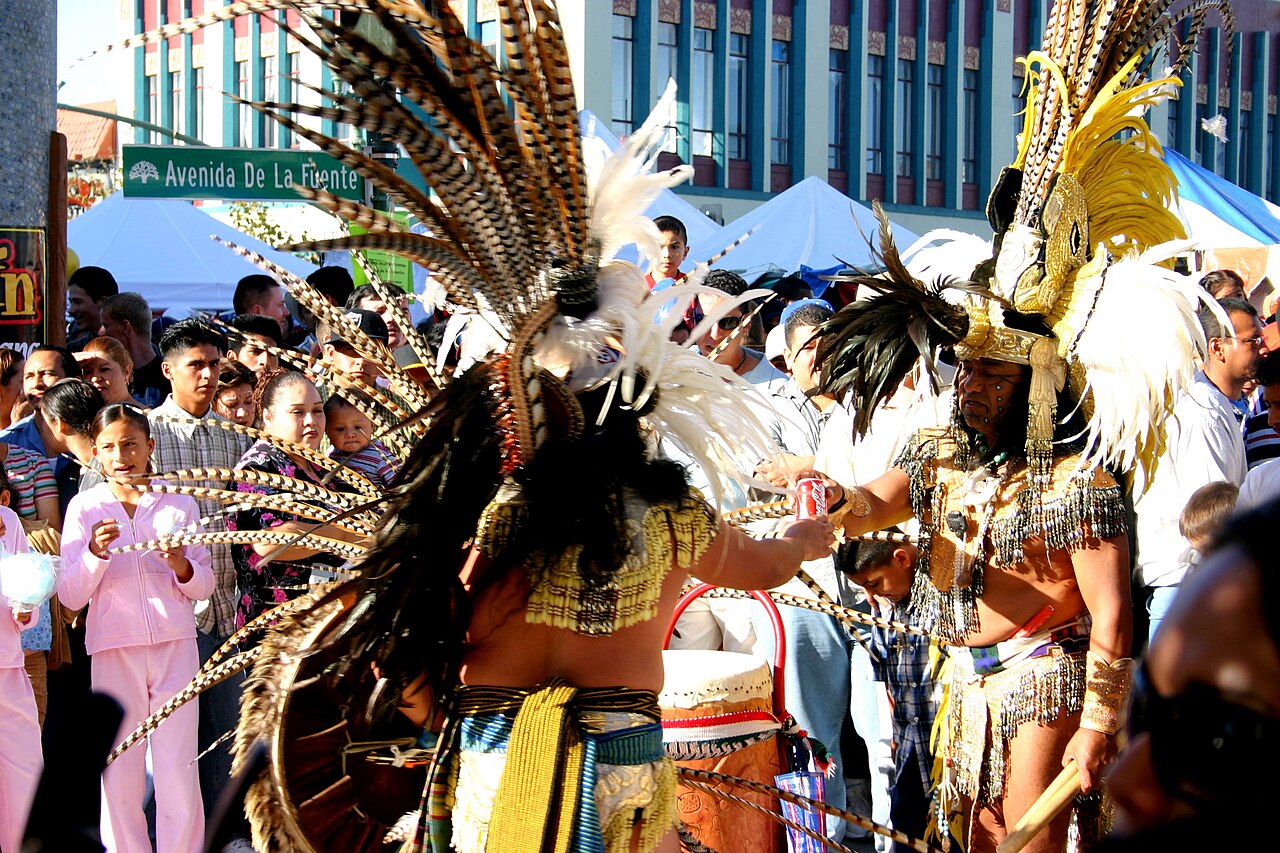
The Park projects page walks through Lake Merritt, the Fruitvale corridor, and Joaquin Miller Park as three different versions of public space and access. After they built it discusses rent data and limits of what charts can show. Resistance covers organizing that tries to hold both green space and stable housing in the same frame.
Sources include urban environmental justice scholarship, Bay Area housing history, and Oakland planning documents. A compiled research pass with citations and flagged gaps lives in Green_Divide_Research_Pass.md (same folder as this site).